Perplexity Enterprise provides comprehensive audit logging capabilities that allow organizations to track user activities and administrative actions.
Audit Logs capture end-to-end queries across user input, agent steps, and answers, as well as any settings changes made by an admin. Each log entry captures essential information such as the “event type” (an action taken by a "user"), the time of the event, and the user’s details like email and IP address. You can find an example below.
Audit Logs are delivered in real time to a webhook endpoint that you configure via HTTP POST requests, providing a detailed, chronological record of all user actions and system events within your organization.
Audit Logs are exclusive to Enterprise Organizations with 50 seats or more, or with at least one Enterprise Max user.
Enabling Audit Logs
To enable Audit Logs for your organization:
Navigate to your Organization Settings in the Perplexity Enterprise portal
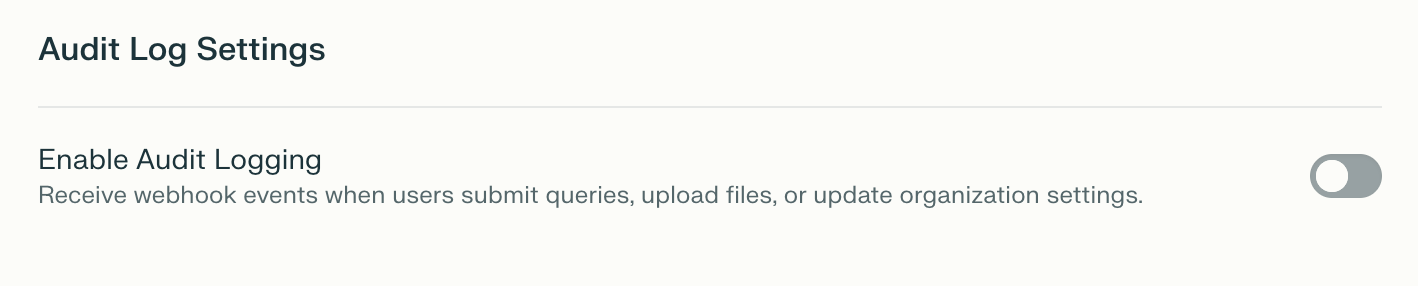
Scroll down to Audit Log Settings and Enable Audit Logging
Configure your Webhook URL (must be HTTPS) and click Save
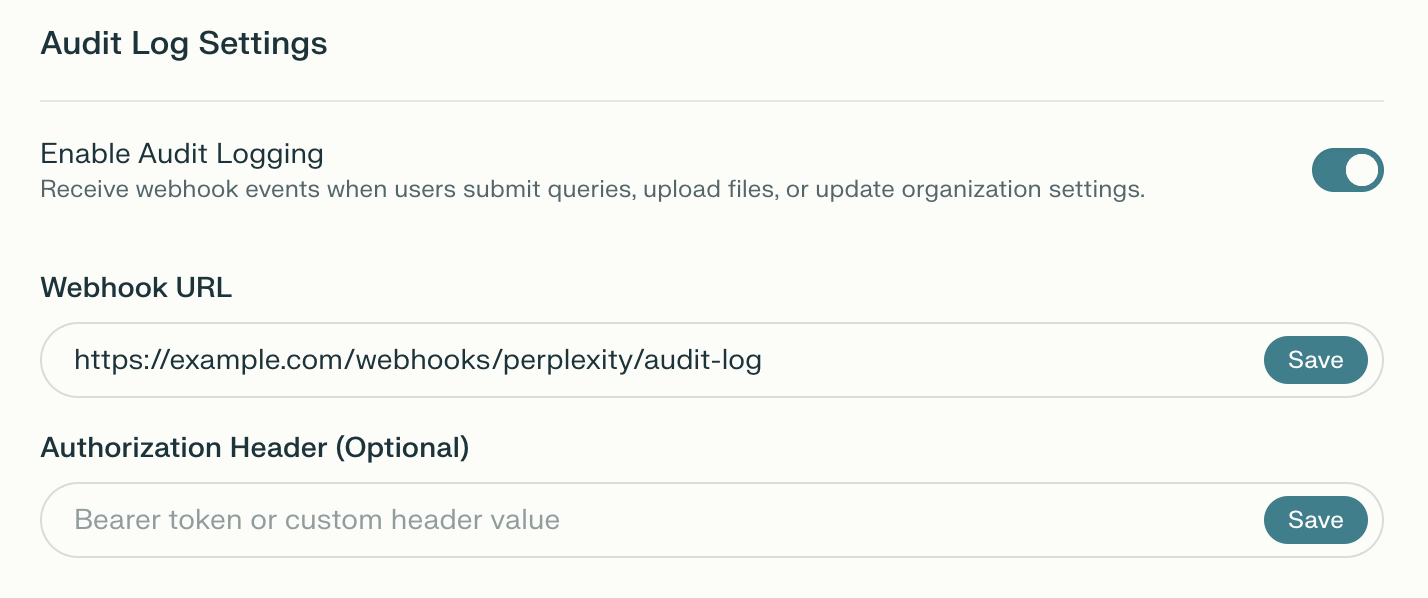
For added security, you can set an Authorization Header that will be used to authenticate all requests to your Webhook URL. Unless you specify an authorization scheme, the value you enter will be sent as a Bearer token
Webhook Authentication
You can secure your webhook endpoint using either:
Bearer Token
Provide a token without spaces. The system will automatically prepend Bearer to the header.
Example:
your-secret-token-123Sent as:
Authorization: Bearer your-secret-token-123
Custom Authorization Header
Provide a complete authorization header value (must contain a space).
Example:
Splunk xyz-token-456Sent as:
Authorization: Splunk xyz-token-456
Webhook Delivery
Request Format
Audit logs are delivered to your webhook URL via HTTP POST requests with:
Method:
POSTContent-Type:
application/json
Authentication Header
If you configured an authentication header token, it will be included in the request:
Authorization: Bearer your-token-123
Or for custom headers:
Authorization: Splunk your-token-456
Response Handling
Your webhook endpoint should respond with HTTP 2xx status codes to indicate successful receipt
HTTP 4xx or 5xx status codes will be logged as errors in Perplexity's system
Audit Log Schema
All audit log events follow this standard schema:
Field | Type | Required | Description |
| string | Yes | Unique identifier for this audit log event (auto-generated UUID v4) |
| string | Yes | ISO 8601 timestamp in RFC3339 format (e.g., |
| string | Yes | Type of event that occurred (see Event Types) |
| string | Yes | Email address of the user who performed the action |
| string | Yes | IP address of the client that initiated the action |
| string | Yes | User agent string of the client browser or application |
| string | No | Session identifier for tracking related actions (may be null) |
| object | No | Event-specific additional data (structure varies by event type) |
Event Types
Below you will find a definition for each event type you may find in your Audit Logs:
User Activity Events
Event Type | Description |
| User successfully authenticated and logged in |
| User submitted a search query |
| AI-generated answer was returned to the user |
| User uploaded a file to a query or space |
| User downloaded a file from a space |
Administrative Events
Event Type | Description |
| Organization settings were modified by an admin |
| Internal admin action performed (for Perplexity staff use) |
| Multiple users were added to the organization |
| Multiple users were removed from the organization |
Agent Events
Event Type | Description |
| Comet agent performed an automated action |
Payload Examples
The following entry is logged when a user submits a search query:
{
  "uuid": "6ba7b810-9dad-11d1-80b4-00c04fd430c8",
  "timestamp": "2024-01-15T14:25:12.345678+00:00",
  "event_type": "query",
  "user_email": "[alice@company.com](<mailto:alice@company.com>)",
  "ip_address": "203.0.113.45",
  "user_agent": "Mozilla/5.0 (Windows NT 10.0; Win64; x64) AppleWebKit/537.36",
  "session_id": "query_xyz789",
  "metadata": {
    "query_str": "What are the best practices for API security?"
  }
}
Platform-Specific Formatting
Slack Webhooks
If your webhook URL is a Slack webhook ([../assets/img/cb370d0539__gt...), audit logs are automatically formatted using Slack's Block Kit format for rich display:
{
  "blocks": [
    {
      "type": "section",
      "text": {
        "type": "mrkdwn",
        "text": "*Event Type:* Answer Generated"
      }
    },
    {
      "type": "section",
      "text": {
        "type": "mrkdwn",
        "text": "*User:* [alice@company.com](<mailto:alice@company.com>)\n*IP Address:* 203.0.113.45\n*User Agent:* Mozilla/5.0...\n*Session ID:* query_xyz789\n*Timestamp:* 2024-01-15T14:25:18.987654+00:00"
      }
    },
    {
      "type": "section",
      "text": {
        "type": "mrkdwn",
        "text": "\n*Metadata:*\n• *answer:* API security best practices include...\n• *model:* claude-3-opus"
      }
    }
  ]
}
Note: Slack formatting includes:
Event type is converted to title case with underscores removed
Metadata values are truncated to 500 characters if they exceed this limit
Total metadata section is truncated to 2,500 characters to comply with Slack's 3,000 character limit
Long values show truncation notice with original length
Splunk HTTP Event Collector (HEC)
If your authentication header starts with "Splunk", audit logs are automatically wrapped in Splunk's required format:
{
  "event": {
    "uuid": "a1b2c3d4-e5f6-7890-abcd-ef1234567890",
    "timestamp": "2024-01-15T10:30:45.123456+00:00",
    "event_type": "login",
    "user_email": "[user@company.com](<mailto:user@company.com>)",
    "ip_address": "192.168.1.100",
    "user_agent": "Mozilla/5.0...",
    "session_id": "session-abc-123",
    "metadata": {}
  }
}
Generic Webhooks
For all other webhook URLs, the standard JSON payload (as shown in the Example Payloads section) is sent without additional formatting.
Common Scenarios
Tracking User Research Sessions
To track a user's research session from query to answer:
Query Event: User submits a question
Contains
query_strin metadataHas a
session_idthat links to the query
Answer Generated Event: AI returns an answer
Same
session_idas the query eventContains the full
answertext and AImodelusedCan be correlated with the query event via
session_id
Monitoring File Access
To track which files are being accessed:
File Upload Event: User adds a file to a space
Contains
filename,file_uuid,space_name, andspace_uuid
File Download Event: User downloads the file
Same
file_uuidcan be used to correlate with uploadShows who accessed the file and when
Auditing Configuration Changes
To track administrative changes:
Organization Settings Update Event:
Admin modifies a setting
Contains
keyof the setting that changedShows
old_valueandnew_valuefor comparisonCan be filtered by
user_emailto track which admins made changes
Best Practices
Webhook Endpoint Implementation
Respond Quickly: Your endpoint should respond within 1 second to avoid timeouts
Process Asynchronously: Queue audit logs for processing and respond immediately
Validate Payloads: Verify the structure and content of incoming payloads
Secure Your Endpoint: Use HTTPS and validate the authentication header
Handle Failures Gracefully: Log errors but don't return error responses that could cause retries
Data Retention and Analysis
Store Long-Term: Keep audit logs for compliance and security analysis
Index Key Fields: Index
event_type,user_email,timestamp, andsession_idfor efficient queryingCorrelate Events: Use
session_idto link related events (queries and answers)Monitor Patterns: Watch for unusual access patterns or suspicious activity
Export Regularly: Maintain backups of audit logs outside the webhook system
Security Considerations
Protect Webhook URLs: Keep your webhook URL and authentication token confidential
Rotate Tokens: Periodically rotate your authentication tokens
Monitor Webhook Failures: Track failed deliveries to detect endpoint issues
Validate IP Sources: Consider validating that webhook requests come from Perplexity's IP ranges
PII Handling: Audit logs contain user emails and IP addresses - handle according to your privacy policies
JSON payload examples for audit log events
/* Query */
{
  event_type: "query"
  timestamp: 2025-02-20T09:05:31
  user_email: "john@perplexity.ai"
  ip_address: "162.229.229.229"
  user_agent: "Mozilla/5.0 (Macintosh; Intel Mac OS X 10_15_7) AppleWebKit/537.36 (KHTML, like Gecko) Chrome/133.0.0.0 Safari/537.36"
  metadata: {
    query: "What were the results of our most recent pentest report?"
  }
}

/* File Upload */
{
  event_type: "file_upload"
  timestamp: 2025-02-20T09:05:31
  user_email: "john@perplexity.ai"
  ip_address: "162.229.229.229"
  user_agent: "Mozilla/5.0 (Macintosh; Intel Mac OS X 10_15_7) AppleWebKit/537.36 (KHTML, like Gecko) Chrome/133.0.0.0 Safari/537.36"
  metadata: {
    file_name: "soc2_report.pdf"
    file_uuid: "XXXXX"
    space_name: "Security Reports"
    space_uuid: "YYYYY"
  }
}
Frequently Asked Questions
Can I use this feature if I have less than 50 seats in my org?
If your organization has fewer than 50 seats, you can upgrade at least one seat to Enterprise Max to access Audit Logs for your organization.
I have activated the feature by mistake and I've been charged for additional seats.
If you have activated Audit Logs by mistake and you're not ready to upgrade to 50+ seats, we can adjust billing for your account and undo any additional billing or payments. Please make sure that you've deactivated this feature and get in touch.