New visibility into your Organization's Perplexity usage
Enterprise organization administrators often need to understand how Perplexity is being adopted across their organizations. Insights is a new analytics dashboard designed to give you clear, actionable data about how your teams are using Perplexity, in a format that’s easy to digest and share.
What is Insights?
Insights is the analytics hub for Perplexity Enterprise organizations with 50 seats or more, or with at least one Enterprise Max member. We have built Insights to help admins understand how their teams are using Perplexity, what types of queries they use, and how engagement is evolving over time.
The data is presented in an approachable dashboard, and can be filtered and exported.
Core Metrics
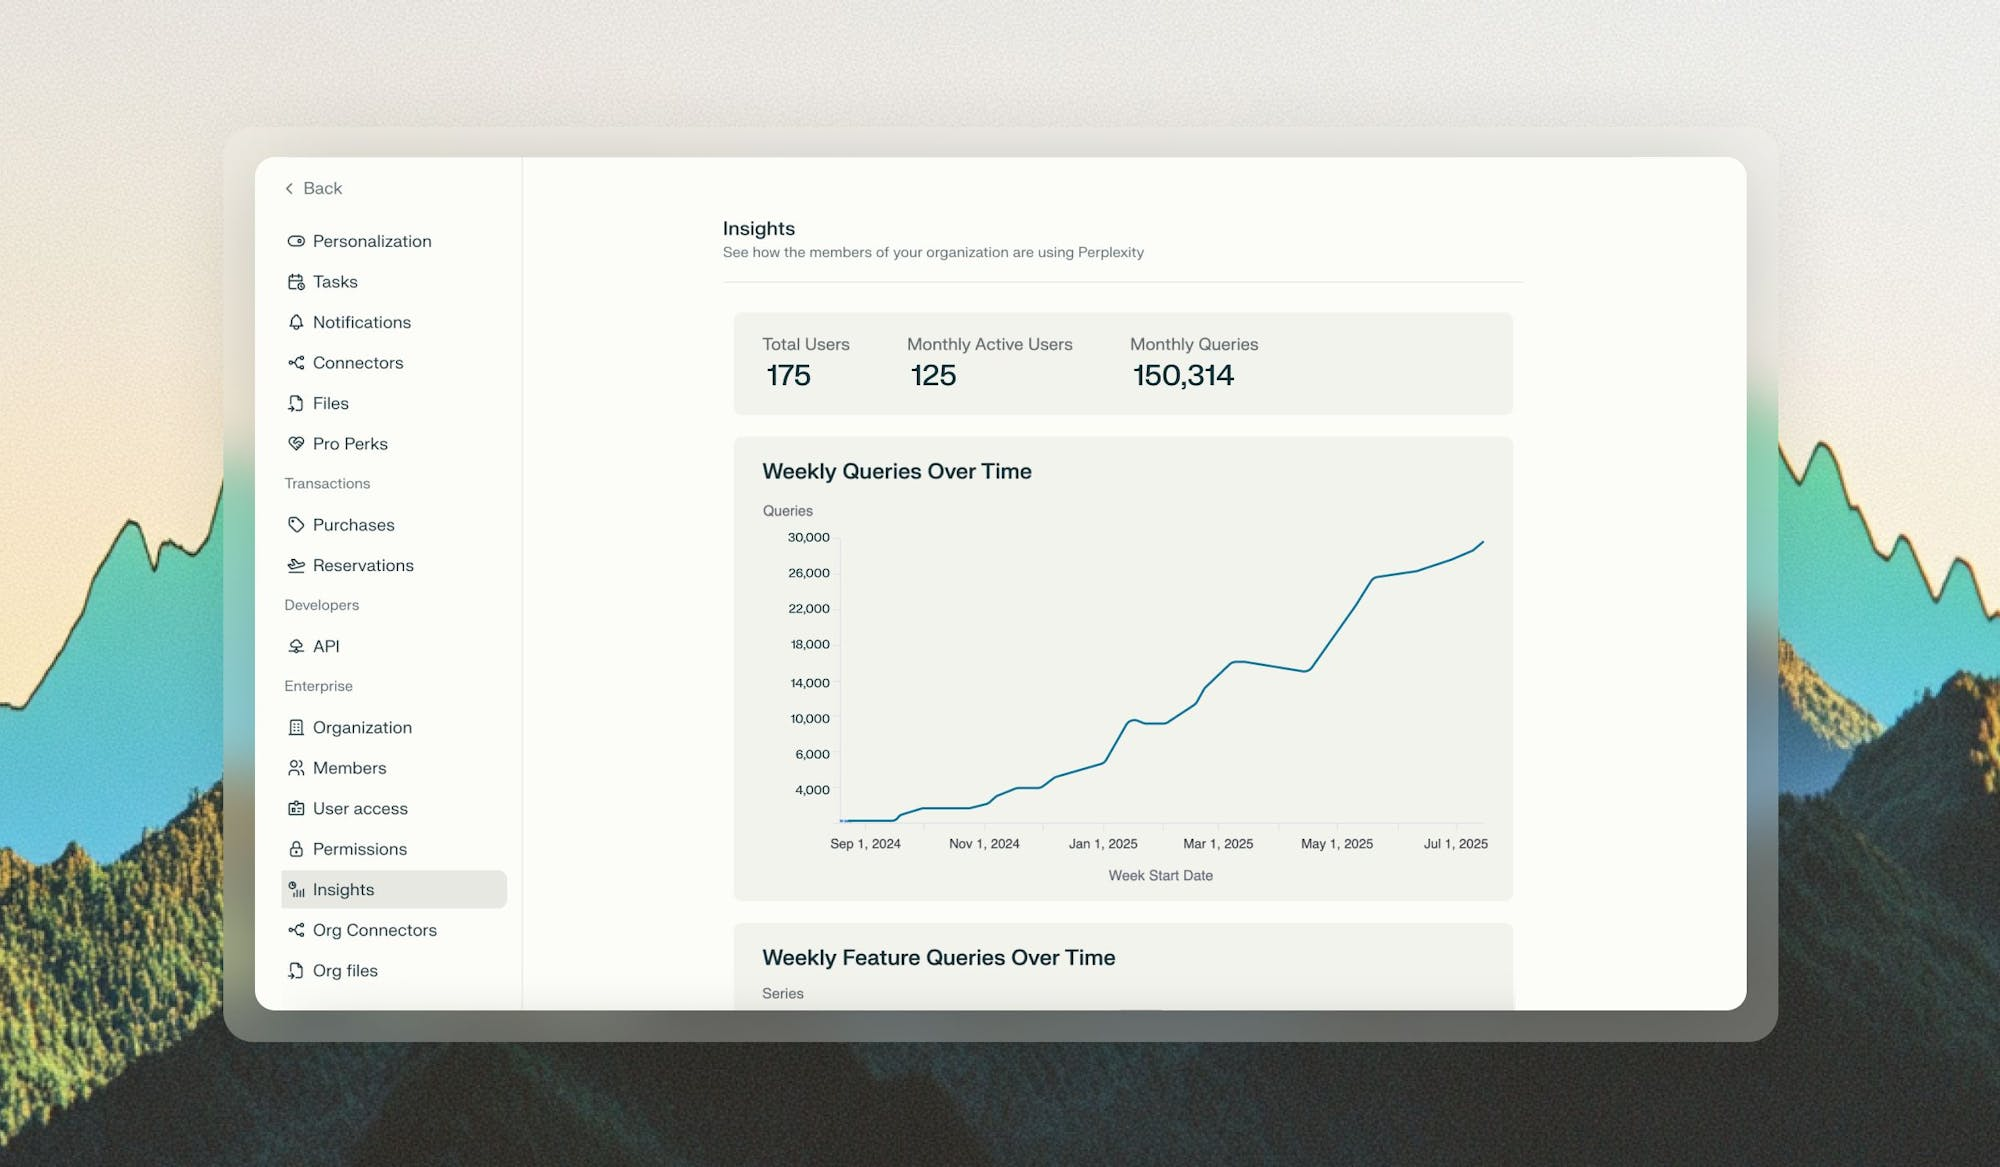
At the top of your Insights dashboard, you’ll find the following core metrics:
Total Users: Total registered users in your organization
Monthly Active Users: How many users in your organization have used Perplexity in the current month
Monthly Queries: Number of queries ran in your organization in the current month
Usage Charts
In addition to the core metrics, the Insights dashboard includes the following charts:
Weekly Queries Over Time: Track query usage patterns over time to identify seasonal trends or adoption curves
Query Type Breakdown Over Time: See the split between queries using internal files versus web-only searches
Total Users Over Time: Monitor the growth of your Perplexity organization over time
Monthly Active Users Over Time: Track your organization’s Perplexity activity over time
You will also see a List of Organization Users, with the number of queries each user has ran in the past 7 and 30 days, and a List of Invited Users, with all users that have been invited to your organization and the date when they were invited.
These charts can be filtered by clicking legend items if you’d like to focus on specific data points. Additionally, you can export the data if you’d like to conduct deeper analysis.
Example chart
How to Access Insights
Only organization admins have access to Insights.
To access Insights: Go to Settings > Insights.
The Insights dashboard is exclusive to Enterprise organizations with 50 seats or more, or with at least one Enterprise Max member. If you’d like to upgrade your organization to access these features, contact enterprise@perplexity.ai.